
This project is about how I turned a topographic map into a 3D model.
A topographic map is a 2D representation of a given region our planet. Nonetheless, it goes beyond the maps we are used to since it also brings information about the height or depth from features of this region.
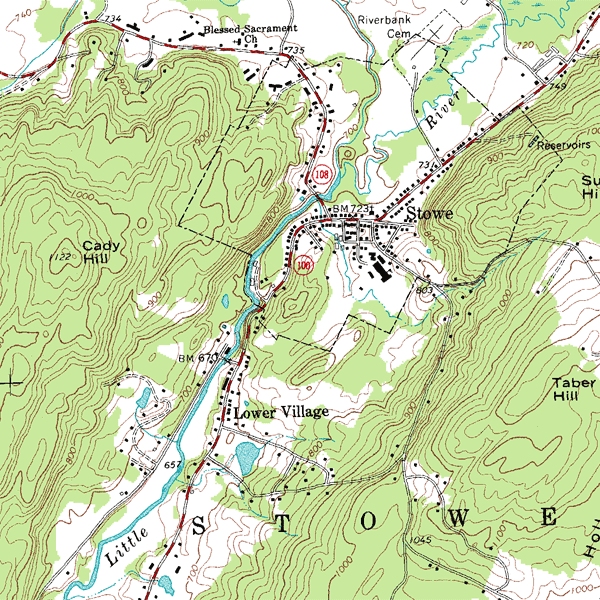
The information regarding elevation or depth is conveyed through what is called contour lines, shown as the thin brown lines in the picture above. They are imaginary lines that connect points that are at the same level above/below a given reference level (e.g. sea level). In this example, the difference in height between two consecutive lines is 20 foot (~6.1m) and Caddy Hill is 1,122 foot (342m) higher than the reference level.

We can consider topographic maps as a way of describing three-dimensional information in a two-dimensional medium. Therefore, they are the perfect starting point for a 3D printing project.
I came up with a three-step plan to go from 2D map to 3D model. Firstly, I needed to find a topographic map and retrieve elevation data from it. Then, use this to build a digital 3D model. Lastly, print it in PLA. Down below, you’ll find a summary of how thins went during this project.
Fetching elevation information
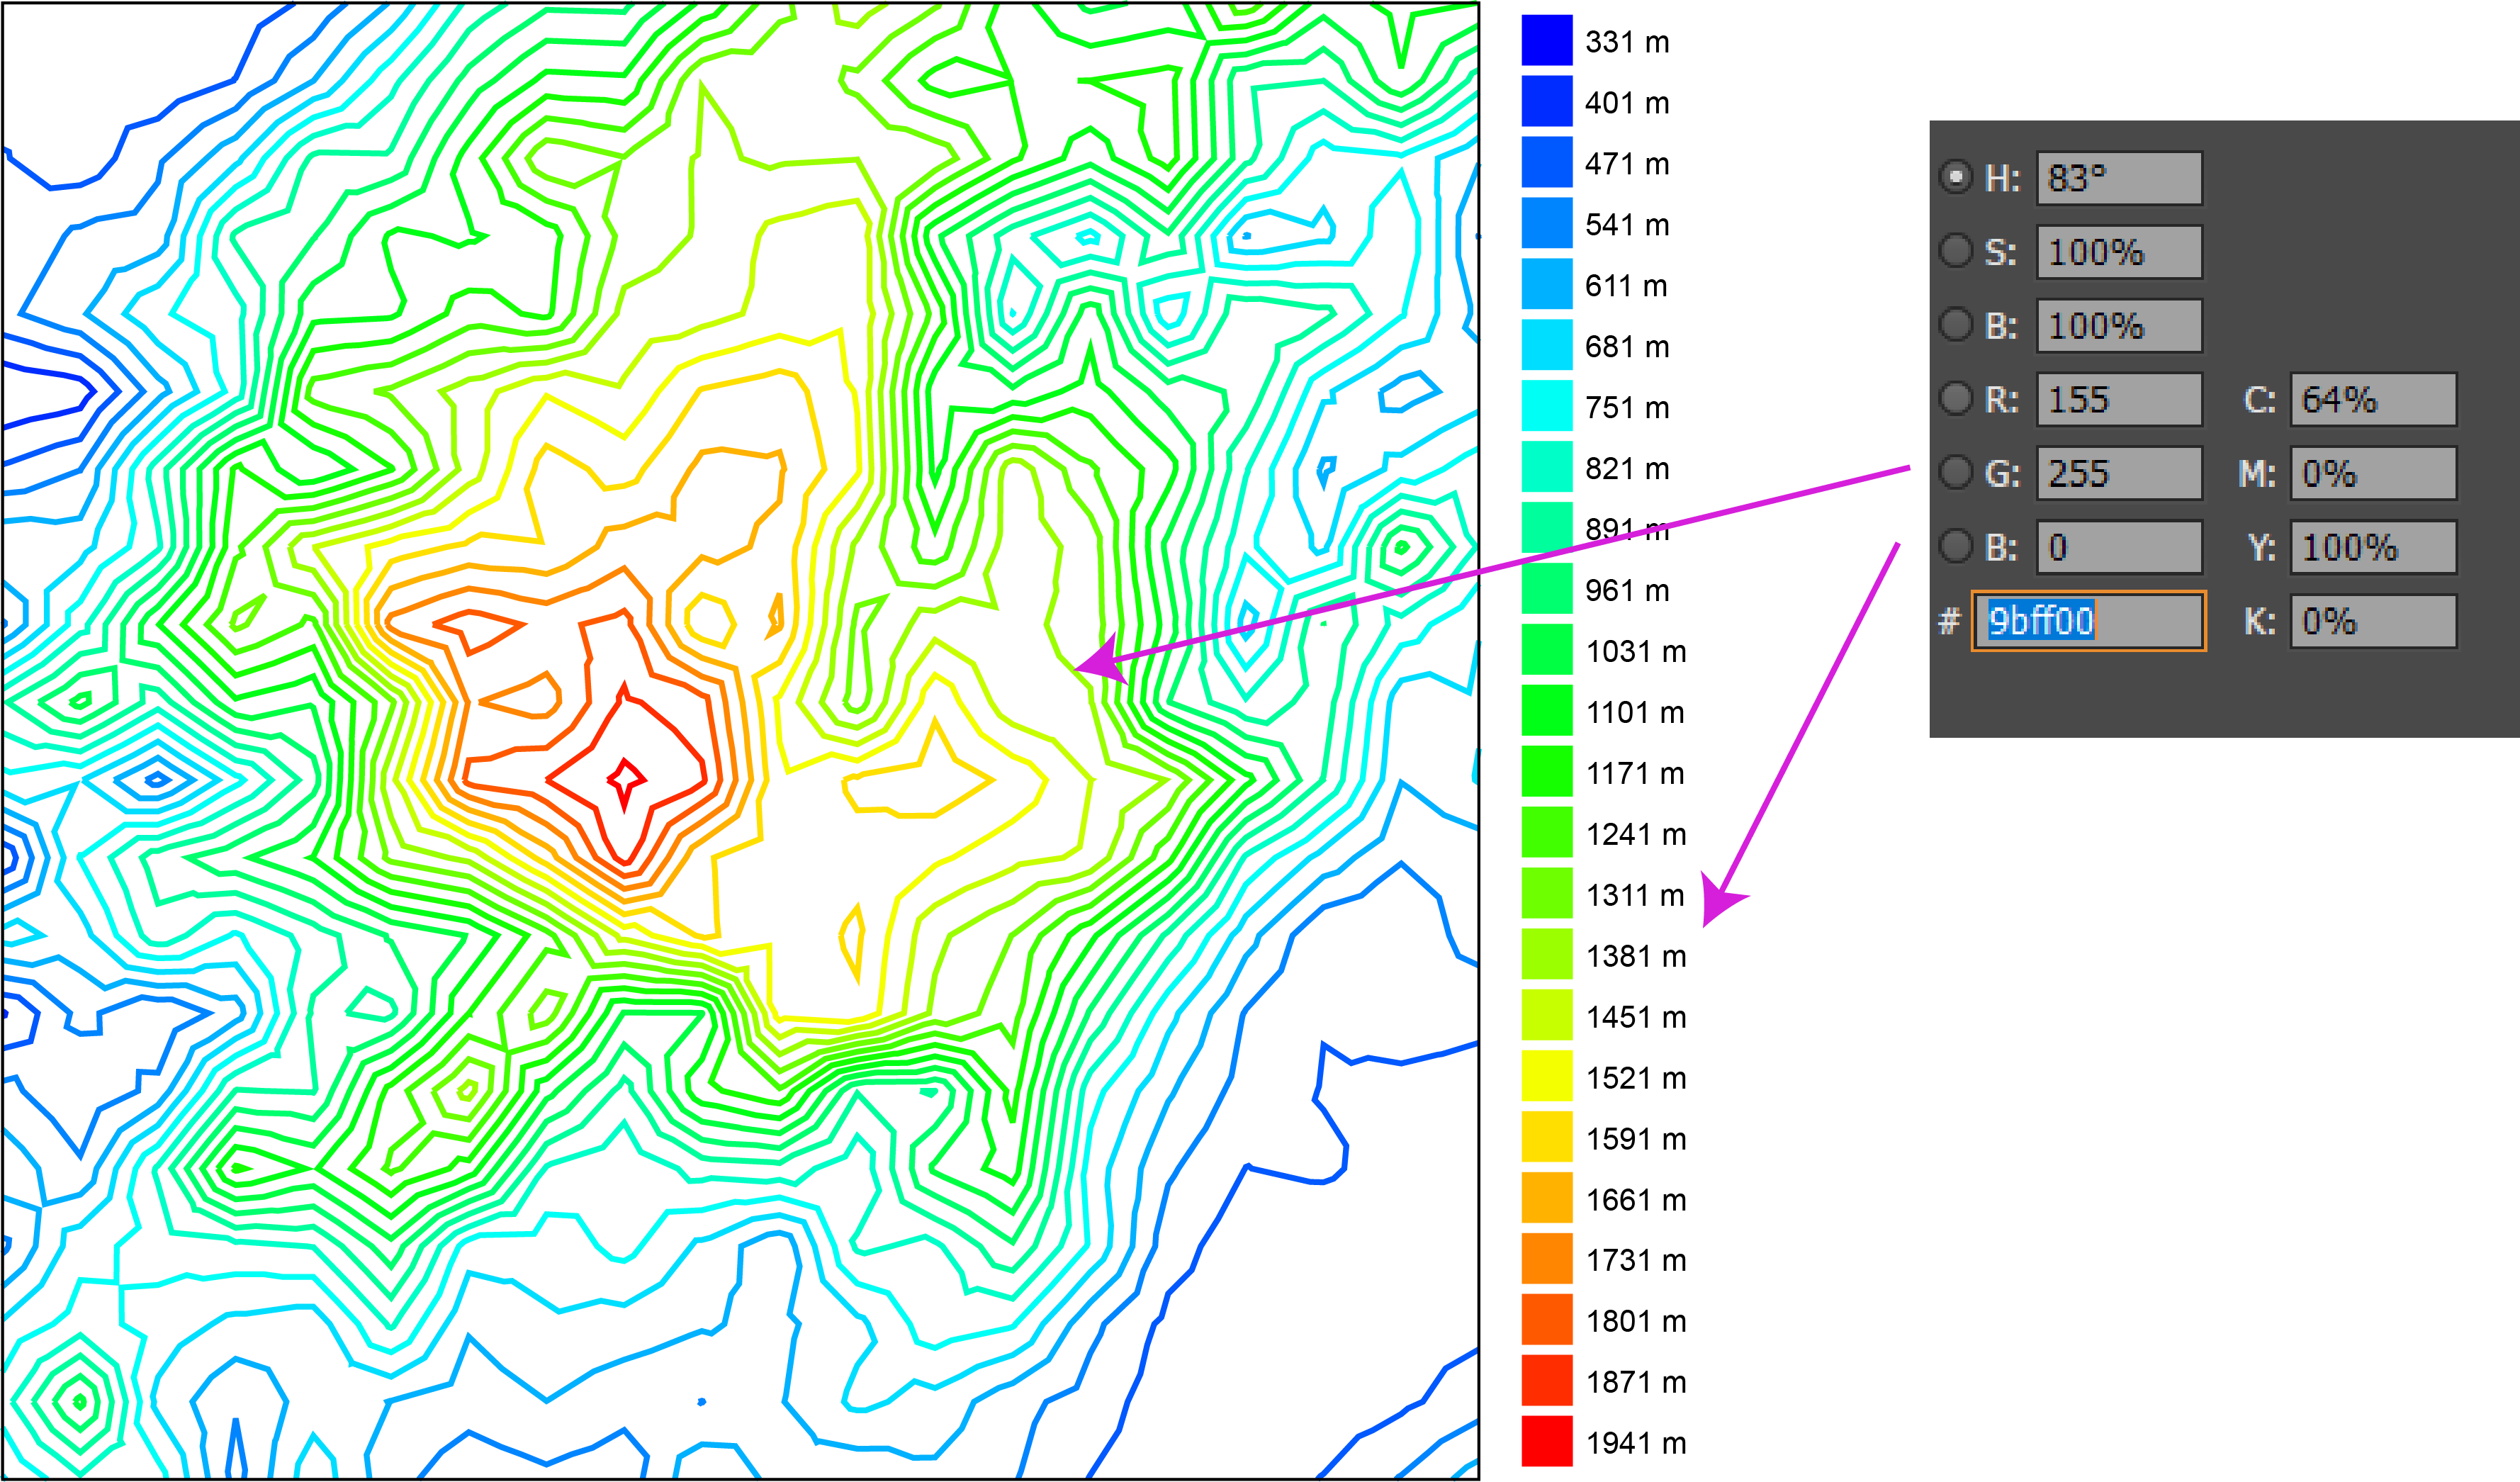
The starting point was to pick a region. I’ve chosen the Serra da Estrela mountain range in Portugal because it’s beautiful and the mini mountains would probably look great. Next, I used the Contour Map Creator v0.310 website, created by Christoph Hofstetter to obtain elevation data and the contour lines. It’s an easy-to-use and amazing tool that lets you customize several map parameters like grid detail and height interval and export in several formats. In the picture below, you can see an example of the output with the contour lines, grid points and color scale.

Building the 3D model
I’ve chosen to export data from Map Creator to a .svg format file. This was particularly handy because Fusion 360, which is the software that I use to create my 3D models, is able to import a .svg file directly into a sketch. Since each contour line is a closed loop and thus delimits an area, it’s possible to select it and extrude for a given height. By repeating this for all lines, I can build a 3D model of the terrain layer by layer.
Though this seemed like a good idea, it wasn’t because Fusion 360 doesn’t display colored lines, they are all black, so it was impossible to determine the corresponding elevation using the color scale.

The solution I used was far from ideal and has consumed a lot of time. I used an image editor to determine the exact color for each line and consequently its elevation. Then, I would manually find the same line in Fusion and extrude it.
The last thing before I could start actually building the model was to decide how tall would I want it to be. This was a tradeoff since big prints are eye-catching but they also take forever to print. For me, 25mm (~1 inch) seemed like the sweet spot, so each 70m elevation step in the real world would correspond to (25mm x 70 m) / (1.941m – 331m) = 1,09 mm in my model.
All the hard work paid off when I saw the realistic rendering of the model. You can find more photos on Instagram.

One final check to see if the mesh was ok with Nettfabb and… Houston, we are go!
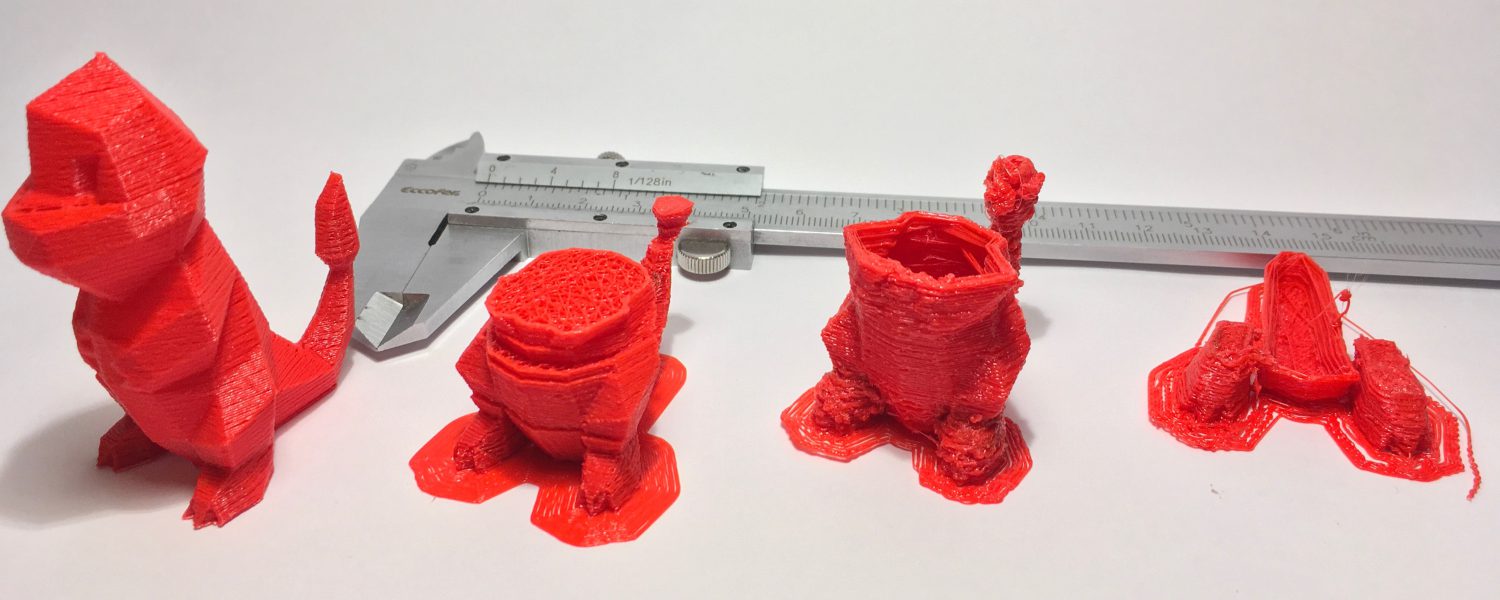
Time to print it!
As the real world eats planning for breakfast, things didn’t go as smoothly as I thought. At a specific height, the model started to print everything in the wrong position, as shown in the picture below. Later, I found out that this issue is called layer shift/misalignment.

After searching through some forums (Matter Hackers, RepRap, Simplify3D), I’ve made a list of probable causes.
- Toolhead is moving too fast.
- Mechanical issues with printer’s components (e.g. poorly adjusted tension on the belts, rods are dirty or not correctly aligned).
- Electrical issues (e.g too little/ much electrical current getting to the motors or endstop malfunction).
- Print bed collided with something.
- Printer isn’t located on a stable surface (vibration).
As my printer was printing perfectly before and the problem stars only after several successful layers, I ruled out items 2, 3, 4, 5 and 6, so item 1 is was to blame.
Speed didn’t seem to be the issue since print and non-print speeds were set to fairly standard values. So, I’ve decided to reduce the acceleration rate from 2.500 to 1.250 (mm/s)/s and voilá no more shifted layers 🙂 Excessive acceleration caused the belt to skip some steps relative to the pulley, which in turn caused the layer shift.

P.S.: If you’re experiencing the layer shift problem, offset the model in the z-direction so that the print starts relatively close to the point of failure. I’ve stumbled upon this tip somewhere and it saved me a LOT of time.
End result
Though the second step in my workflow required a lot of work and therefore needs to be optimized, I am satisfied with the print and how much I’ve learned during the process.

Next time, I will try to streamline the way I import elevation data into Fusion 360 such that this requires less user intervention.

If you have suggestions for improvements or if you’ve already tried something similar to this, please feel free to leave a comment or share your experience.
If you want to print the model for yourself, I’ve made it available on my Thingiverse and Pinshape.
See you in my next post!
